

Across three established crypto card programs, cashback did not disappear as usage grew. It became narrower.
 Tria preserved its headline rates while limiting the spending that earns them.

 Plasma One moved from a flat 3% private-beta offer to a 2%–4% tiered ladder, then to current tiers offering up to 1%–3%.
 ether.fi paid $25.3 million of cashback on its first $1 billion of card spend, but its current rates also step down by monthly spend and membership level.
That makes the advertised maximum an incomplete starting point. We compared each headline rate with the return at different spending levels after access costs, fees, exclusions, and reward denomination. We then examined how those structures changed alongside card usage, and how they correlated with program growth.
When Cashback Functions as Acquisition Spend
Cashback creates a cost whenever an eligible payment clears. Interchange—the fee transferred to the issuer in a card payment—is one source of funding for rewards. Issuers also bear processing, network, fraud, compliance, and operating costs.
That makes a high, uncapped rate difficult to fund from payments revenue alone. The constraint is clearest in the EU, where regulation generally caps interchange on consumer card transactions at 0.2% for debit and 0.3% for credit. A card returning several percentage points on every purchase needs another source of funding.
| Market | Gross Interchange | Illustrative Program Share | Net to Program per $1M Spend |
|---|---|---|---|
| MarketUS wallet program | Gross Interchange~1.2% | Illustrative Program Share30% | Net to Program per $1M Spend~$3,600 |
| MarketEuropean fintech | Gross Interchange~0.3% | Illustrative Program Share40% | Net to Program per $1M Spend~$1,200 |
Source: How to Launch a Stablecoin Card Program (2026).
At launch, a shortfall between reward expense and payments revenue can be intentional. Cashback can function as customer-acquisition spend: a cost incurred to acquire an account, prompt a first transaction, and build repeat usage. The economic test is whether those users later generate enough recurring value to recover that cost.
Other funding can include memberships, credit revenue, spreads, revenue generated from deposited assets, merchant-funded offers, and token incentives.
Reward Cost and One-Year Interchange Payback
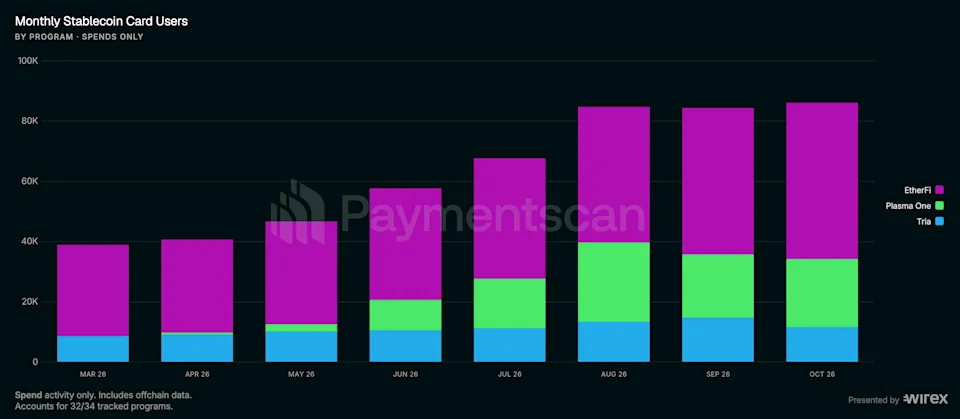
Plasma One’s cashback expansion coincided with faster address growth than the two established programs in this comparison. From June to October 2026, its monthly active addresses increased by 123.6%, compared with 39.9% for ether.fi and 10.1% for Tria.
| Program | Monthly Active Addresses | Average Transaction | Monthly Cashback Paid |
|---|---|---|---|
| ProgramPlasma One | Monthly Active Addresses10,124 → 22,636 (+123.6%) | Average Transaction$125.68 → $181.62 (+44.5%) | Monthly Cashback Paid$240,786 → $749,550 (+211.3%) |
| Programether.fi | Monthly Active Addresses37,051 → 51,839 (+39.9%) | Average Transaction$81.01 → $76.41 (−5.7%) | Monthly Cashback Paid$2.044M → $1.651M (−19.2%) |
| ProgramTria | Monthly Active Addresses10,519 → 11,580 (+10.1%) | Average Transaction$170.51 → $146.60 (−14.0%) | Monthly Cashback PaidNot separately tracked |
Data note: Program comparisons cover June to October 2026. Tria cashback distributions cannot currently be isolated in Paymentscan’s onchain cashback dataset. The reward-cost proxy divides all October cashback by new registrations during the month. Because the cashback also rewarded existing users, it should not be read as Plasma One’s disclosed or cohort-level customer-acquisition cost.
Plasma One paid $749,550 in cashback during October and added 38,763 registered cardholders. Dividing the two produces an upper-bound reward-cost proxy of $19.34 per new registration. At October’s usage rate, registered cardholders averaged approximately $136 of monthly card spend, equivalent to $1,635 on a simple annualised basis. This is processed spend, not customer lifetime value.
For Plasma One’s US-issued, USD-denominated card program, the issuer guide’s US wallet-program example provides a useful benchmark: 1.2% gross interchange with an illustrative 30% retained by the program, or 0.36% net.
Applying these modelling assumptions to the annualised spend figure, the baseline would produce approximately $5.88 of one-year interchange contribution per registered cardholder. That would leave $13.45 of the upper-bound reward-cost proxy unrecovered. At 0.5%–0.6% net interchange, the unrecovered amount would fall to $11.16–$9.53.
| Plasma One Scenario | Annual Interchange Contribution per Cardholder | Cashback per New October Registration | Unrecovered Reward Cost After One Year |
|---|---|---|---|
| Plasma One ScenarioUS baseline: 0.36% net interchange | Annual Interchange Contribution per Cardholder$5.88 | Cashback per New October Registration$19.34 | Unrecovered Reward Cost After One Year$13.45 |
| Plasma One ScenarioLarger-program case: 0.50% | Annual Interchange Contribution per Cardholder$8.17 | Cashback per New October Registration$19.34 | Unrecovered Reward Cost After One Year$11.16 |
| Plasma One ScenarioLarger-program case: 0.60% | Annual Interchange Contribution per Cardholder$9.81 | Cashback per New October Registration$19.34 | Unrecovered Reward Cost After One Year$9.53 |
Headline Cashback Is Not Net Cashback
- Headline: the advertised maximum rate.
- Effective: rewards divided by eligible spend.
- Marginal: what the next dollar earns after a threshold.
- Realised: aggregate rewards paid relative to measured spending.
- Net: what an individual retains after fees, exclusions, access costs, and changes in reward value.
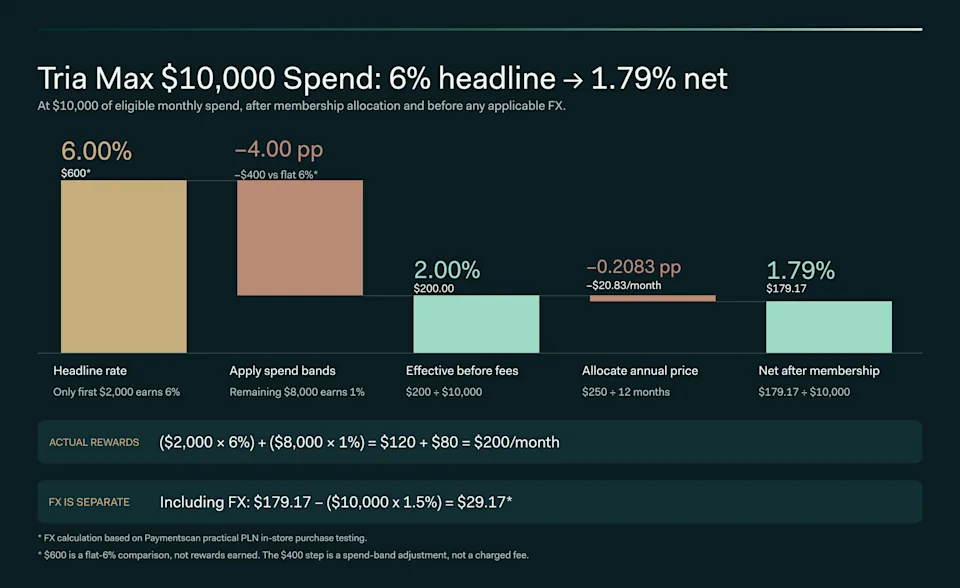
Tria illustrates the difference. Its current Max membership headline is 6% on the first $2,000 of eligible monthly spending, then 1% thereafter. At $10,000 of monthly spend, that produces $200 rather than $600: a 2% effective rate before allocating the tier’s $250 standard annual price or accounting for foreign-exchange costs and other applicable fees. The headline is accurate for the initial band, but it is not the return across the user’s full spending.
Start with the highest-rate band, follow the ladder to likely monthly spend, subtract access costs and fees, then identify the asset or credit delivered.
How Flat Cashback Becomes a Ladder
In these programs, rewards ladders preserve the advertised headline rate while lowering marginal rewards or restricting access. Plasma One and Tria show the transition directly; ether.fi shows the model at larger scale.
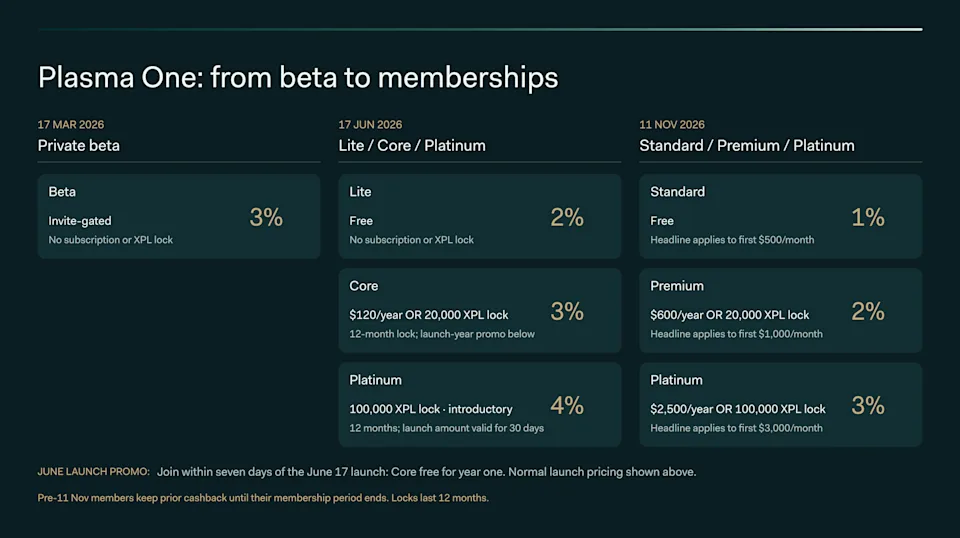
Paymentscan reported that Plasma One opened its invite-only private beta on 17 March 2026 with a flat 3% offer. By the June public launch, Paymentscan’s launch analysis recorded more than $10 million of cumulative onchain card spend and the introduction of Lite, Core, and Platinum tiers.
Plasma revised its public membership structure again on 11 November. New members can choose the free Standard tier with up to 1% cashback, Premium at $600 per year with up to 2%, or Platinum at $2,500 per year or a 12-month lock of 100,000 XPL with up to 3%. Platinum pays 3% on the first $3,000 of monthly spend, 2% on the next $7,000, and 1% thereafter.
Paymentscan recorded $30.15 million of Plasma One card volume in October, up from $1.10 million in March, while active addresses increased from 116 to 22,636. Volume and active addresses rose across a period that included both reward changes.
Tria shows a similar shift. From September 2025 through May 2026, its 1.5%, 4.5%, and 6% tier rates applied to all eligible spending without monthly caps. The program introduced capped high-rate bands from 1 June, with lower rates on additional spending.
The change followed Tria’s highest-volume month in Paymentscan data: $22.91 million in May, with 10,138 active addresses. In October, monthly volume was $15.79 million across 11,580 active addresses. In September, Tria introduced the Lite, Pro, and Max names and widened Lite’s 1.5% band from $100 to $1,000. The headline rates remained, but only limited spending received them.
ether.fi provides a realised-payout benchmark at greater observed scale. Paymentscan recorded $141.9 million of card volume in October across 51,839 active addresses. ether.fi separately disclosed that it paid $25.3 million of cashback on its first $1 billion of spend—a 2.53% cumulative realised rate.
That figure measures rewards actually returned, but it does not mean every current dollar of spend earns 2.53%. Under ether.fi’s current ladder, Core earns 3% on the first $2,000 each month, 1% on the next $1,000, and 0.5% thereafter. Luxe and Pinnacle extend the 3% band, but access requires membership points, qualifying Liquid balances, staked ETHFI, or an annual payment. At that observed scale, the high rate coexists with spending bands and tier-access requirements.
Reward Form Changes the Net Return
The percentage is only one part of a cashback promise. The unit delivered affects when the reward can be used, whether it can be transferred, and the price or redemption risk the user bears.
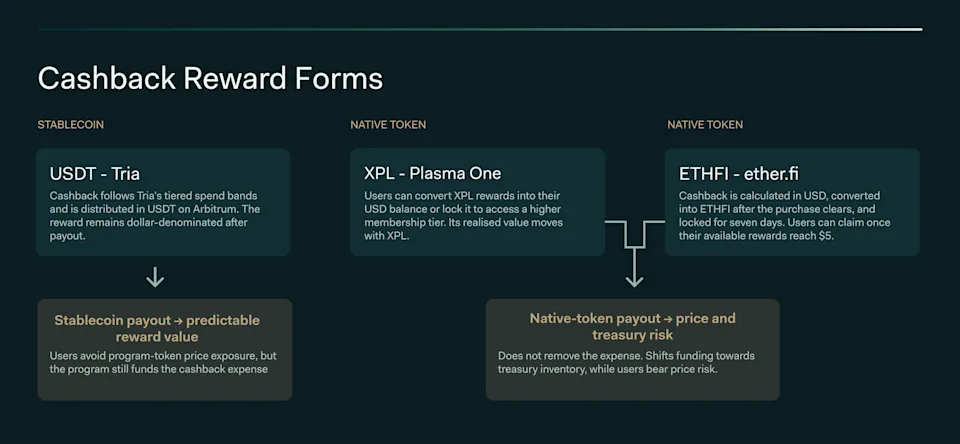
Tria’s cashback payouts are made in USDT. This gives the user an asset designed to track the dollar and delivered to a connected wallet. The reward remains subject to distribution timing and stablecoin risk, but its value is comparatively straightforward to evaluate.
ether.fi takes a different route. Card cashback is calculated in dollars while a purchase is pending. Once the transaction clears, it is converted into ETHFI, locked for seven days, and then becomes claimable. The user therefore receives exposure to ETHFI rather than a fixed dollar balance. A price move between conversion and use can increase or reduce the value ultimately realised. Staked ETHFI can also generate membership points, linking the reward to access within the wider product.
Plasma One’s current base cashback is calculated in dollars and paid in XPL. Separate promotions may instead provide spending credit. XPL can be swapped, subject to market liquidity, slippage, and network fees. Spending credit cannot be withdrawn, transferred, or converted.
Reward denomination therefore affects net cashback. Non-stable tokens add price and liquidity risk; spending credits restrict transfer and redemption; distribution timing affects all three forms.
What the Cashback Ladder Shows
A cashback program does not need to preserve its launch offer unchanged. Long-term viability depends on a recurring source of funding and terms that can operate beyond the acquisition phase. Spending bands, paid tiers, and access requirements show where the highest subsidy is concentrated; they do not, by themselves, prove that the program is profitable.
For users, the relevant comparison is the net return at their own spending level. For operators and analysts, it is the relationship among reward expense, acquired users, subsequent usage, and the revenue attached to those users. The most useful disclosures would therefore be eligible card spend, cashback actually paid, the distribution of spending across reward bands, and the recurring revenue used to fund rewards.
In the programs examined here, high headline cashback coexisted with scale as a segmented benefit rather than an unlimited promise. Plasma One’s latest redesign reinforces the pattern by lowering its public headline rates while concentrating higher rewards in paid tiers.
Data note: Paymentscan figures use tracked card spend and are current through October 2026, the latest complete month at publication. Program terms were reviewed on 15 November 2026. Plasma’s public membership pages and its September Rewards Addendum currently use different tier names; Tria’s current sources disagree on the Pro high-rate spending band. Neither conflict affects the Max or ether.fi calculations used here.